
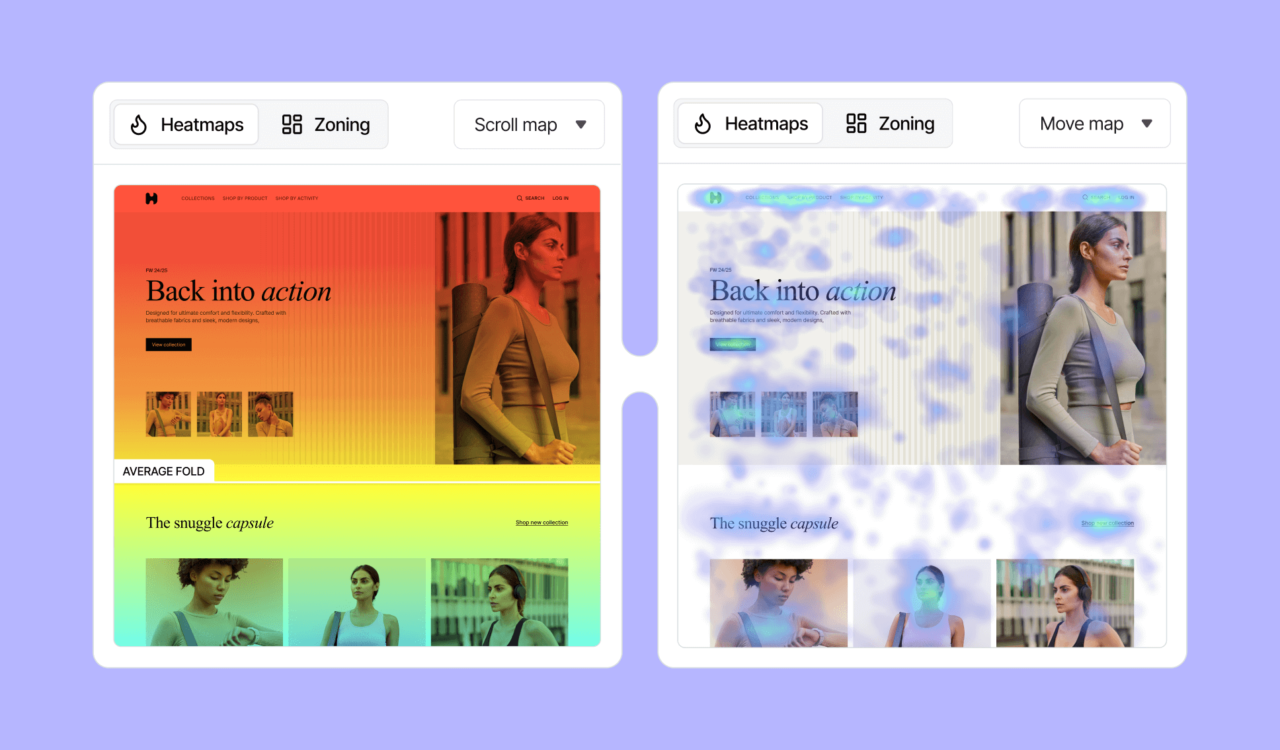
Property listing pages are conversion pages. A visitor may arrive from Google, a paid ad, an email, a portal, or social media and then decide within seconds whether to keep looking, open the photo gallery, check the map, calculate affordability, contact the agent, or leave. Heatmaps help real-estate teams understand those aggregated interactions. Instead of asking only how many people viewed a listing, a heatmap can show which elements they clicked, how far they scrolled, which page areas received interaction, and—depending on the analytics platform—which interactions appear to contribute to conversions. A Real Estate Marketing Agency may use heatmaps as part of a broader conversion-rate optimization process, but the tool is useful only when its data is interpreted carefully. A hot area does not automatically mean users liked it, and a mouse pointer should not be treated as a precise eye-tracking device. Microsoft Clarity’s current 2026 heatmap system, for example, supports click maps, scroll maps, area maps, conversion maps, and attention maps. Its click maps can also classify dead clicks, rage clicks, error clicks, first clicks, and last clicks. These behavioral signals are more useful than the older assumption that cursor movement directly reveals where a visitor is looking. This guide explains how to use heatmaps on real-estate listing pages, what each map type can reveal, how to segment visitors by device and traffic source, how to identify friction in photo galleries and contact forms, how to combine heatmaps with session recordings and analytics, and how to turn observations into controlled tests rather than random redesigns.
What Heatmaps Can—and Cannot—Tell You
A heatmap is an aggregated visualization of user interaction across a webpage. Colors are commonly used to indicate higher and lower activity. Depending on the tool, heatmaps can visualize: clicks or taps; scroll reach; interaction within defined areas; attention or time; conversion contribution. The current Microsoft Learn — Heatmaps Features and Limitations documentation is a useful caution against overinterpretation. Clarity limits a heatmap to 100,000 page views, retains heatmap data for up to nine months, uses CSS element selectors, and has limitations around dynamic elements and very long pages. Heatmap data is therefore behavioral evidence, not a perfect visual recording of every visitor experience. Heatmaps Do Not Tell You Why by Themselves. A heatmap can show that many people click a floor-plan image. It cannot automatically tell you whether they: liked the floor plan; could not read it; expected it to open larger; were searching for room dimensions.
That is why heatmaps should be combined with: session recordings; analytics; form data; user feedback; A/B tests.
Why Property Listing Pages Benefit From Behavioral Data
Listings contain many competing elements: hero photo; gallery; price; address; bed/bath count; square footage; description; amenities; map; agent profile; mortgage calculator; contact buttons; similar properties. Heatmaps can reveal whether the visual hierarchy matches actual visitor behavior. Start With the Listing’s Primary Conversion. Before opening a heatmap, define what success means. Common goals include: schedule a viewing; call the agent; send an inquiry; request more information; start a mortgage prequalification; save the property; share the listing. If the primary goal is unclear, heatmap optimization becomes arbitrary. Microsoft Learn — Clarity Heatmaps shows that modern heatmap analysis goes beyond a single colored screenshot. Clarity supports click, scroll, area, conversion, and attention views as well as filters and segments, which makes it possible to compare behavior on desktop and mobile or isolate traffic sources instead of mixing every visitor into one average.
Click Maps, Dead Clicks, and Rage Clicks
Click maps show which page elements users click or tap. On a property page, useful targets include: gallery arrows; photo thumbnails; “View all photos”; map; phone number; agent card; schedule-tour button; mortgage calculator; floor-plan download; similar listings. Dead Clicks. A dead click occurs when a user clicks something that does not produce the expected response. On a property page, this might happen when visitors click: a static photo expecting zoom; an amenity label expecting more detail; an address expecting a map; a floor-plan thumbnail that is not linked. Dead clicks can reveal mismatches between visual design and user expectations. Rage Clicks. Rage clicks are repeated clicks in a small area over a short time.
They can indicate: slow gallery; unresponsive button; broken modal; form validation problem; frustration with a map or calculator. Do not treat every rage click as a technical defect, but investigate repeated patterns. Error Clicks. Some analytics platforms can flag clicks associated with client-side errors. On a listing page, this can help identify failures involving: booking widgets; maps; forms; gallery scripts; mortgage tools. First Clicks. The first interaction can reveal what visitors prioritize immediately. If most first clicks go to the gallery, that supports a photo-first experience.
If people immediately click the map, location may be more important for that audience. Last Clicks. Last-click behavior can help identify where sessions end. For example: a call button may be a successful last click; a broken gallery button may be a frustrating one. Context matters. Microsoft Learn — Scroll Maps can help identify how far visitors travel down a listing page, but a colder lower section is not automatically a bad section. Users who found the needed information near the top may convert without scrolling, while serious buyers may deliberately inspect long descriptions, disclosures, maps, and similar listings. Scroll depth becomes useful when it is connected to a conversion goal and segmented by device.
Scroll Maps and the Real Meaning of Drop-Off
Scroll maps show how far visitors travel down the page. Microsoft Clarity’s current scroll maps report: percentage of visitors reaching page sections; drop-off at different page depths; average fold. The Average Fold. The average fold represents the approximate content users see before they begin scrolling, based on the devices in the data. This is valuable because the fold is not one fixed pixel position. It changes with: mobile screen; desktop monitor; browser size; device orientation. What Should Appear Near the Top?. Most property pages should make core decision information easy to find early:
price; location; property type; beds; baths; size; primary contact action. That does not mean every detail must be above the fold. Scroll Drop-Off Is Not Automatically Bad. A visitor may stop scrolling because: they found the phone number and called; the property was clearly unsuitable; they completed a form; they switched to the gallery. Always compare scroll data with conversion data.
Area, attention, and conversion maps. Area maps aggregate clicks within a defined region. Useful listing-page areas can include: hero/gallery area; property facts; description; amenities; agent card; finance section; similar listings. This can help compare major content blocks instead of individual buttons. Attention Maps. Attention maps attempt to show which page sections receive more viewing attention based on the analytics tool’s methodology. They should be interpreted as behavioral analytics—not literal eye tracking. Unless a study uses eye-tracking hardware, do not claim that a heatmap shows exactly where a visitor looked. Why Mouse Movement Is Not Gaze. Older heatmap articles often say cursor movement “tracks attention.” That is too strong. A user can: read without moving the mouse; leave the cursor parked while scrolling; use touch instead of a mouse; move the pointer while looking elsewhere. Use interaction data for what it actually measures. Conversion Maps. Conversion maps can help connect interactions or page areas with defined conversion outcomes. For a listing, conversion events could include: tour request; contact form submit; phone-click; email-click; save property. Make sure events are configured correctly before trusting the map.
Segment Heatmaps by Device and Traffic Source
This is essential for real estate. A listing that works well on desktop may fail on mobile. Compare: desktop; tablet; mobile. Mobile Problems Heatmaps Can Reveal. Look for: tiny tap targets; buttons below sticky overlays; gallery controls too close together; long forms; maps that trap scrolling; important facts pushed too far down. Segment by Traffic Source. Visitors from different channels have different intent. Compare: organic search; paid search; social media; portal referral; email; direct. A person searching the exact address may behave differently from someone clicking a broad “luxury homes” ad. Segment by New vs. Returning Visitors. Returning users may: skip the description; go directly to price; reopen photos; contact the agent. New users may explore more broadly. Do Not Mix Every Listing Into One Heatmap. A studio apartment and a $5 million waterfront home attract different behavior. Group similar listings by: property type; price band; market; template; traffic source.
Optimize Galleries, Floor Plans, Facts, and Pricing
Property images are often the highest-engagement section. Heatmaps can help answer: Do visitors click the hero image?; Do they use arrows?; Do they open full-screen view?; Do thumbnails receive interaction?. Photo Order. Do not assume the front exterior image should always be first. Test whether lead images showing: best view; kitchen; living space; waterfront; unique architecture. produce stronger gallery engagement and inquiry. Floor Plans. If floor plans receive strong clicks, give them: larger display; zoom; clear dimensions; mobile-friendly viewing. If users repeatedly click a static floor plan, that is a strong sign they expect interactivity. Property Facts. Check whether users interact around: square footage; lot size; year built; HOA; parking; property tax; school information. These may deserve more prominent placement depending on the market. Price and Financial Information. For many buyers, affordability determines whether they continue. Useful information can include: listing price; estimated payment; HOA; taxes; insurance disclaimer; financing CTA.
Do not present rough calculators as guaranteed loan terms. Mortgage Calculators. Heatmaps can reveal whether calculators are: used; ignored; clicked but abandoned. Combine that with event analytics to see whether calculator use correlates with contact.
Maps, Descriptions, Amenities, and Agent Contact
Users may interact with maps to evaluate: commute; schools; shopping; beach access; transit; neighborhood layout. A map that receives heavy interaction may deserve more space or better nearby-place information. Be Careful With Embedded Maps on Mobile. Large interactive maps can capture touch gestures and make it difficult to scroll the page. Session recordings and rage-click patterns can reveal this problem. Description Length. A scroll map can show whether a very long description pushes important information too far down. Consider: short summary first; scannable bullets; expandable detail; clear H2/H3 sections. Amenities. Instead of a wall of 40 bullet points, group amenities into categories: interior; exterior; building; community; parking; utilities. Agent Contact Card. Track clicks on: call; text; email; schedule visit; agent profile. If most users choose one method, prioritize it. Sticky Contact Buttons. On mobile, a sticky CTA can keep contact accessible. But it can also: cover content; block navigation; create accidental taps. Use heatmaps and recordings to evaluate the trade-off.
Contact Forms, Sticky CTAs, and Similar Listings
Forms fail when they ask for too much too soon. Start with essential fields such as: name; email or phone; message or tour preference. Collect detailed qualification later if possible. Form Friction. Look for: rage clicks on submit; error clicks; abandonment; fields that cause repeated correction. Similar Listings. Click activity on related properties can mean: the visitor likes the area but not this property; price is wrong for them; they are comparison shopping. That is not necessarily a failed session. Keep Leads Inside Your Inventory. Similar-property modules can help retain visitors who reject the current listing. Consider matching by: price; location; bedrooms; property type. Heatmaps and Listing Quality. Behavior can also reveal content deficiencies. Repeated clicks around missing information may indicate demand for: floor plans; video tours; HOA details; school data; additional photos.
Combine Heatmaps With Recordings and Privacy Controls
If a heatmap shows a strange pattern, watch representative sessions. Recordings can help answer: Did the gallery freeze?; Was the form confusing?; Did users repeatedly open the same section?; Did a popup obscure the CTA?. Privacy and Consent. Behavior analytics can involve user data and must be implemented with appropriate privacy controls. Microsoft Clarity’s documentation includes: consent management; consent APIs; data collection guidance; privacy-policy disclosure. Requirements vary by jurisdiction. Mask Sensitive Data. Do not expose in analytics: personal messages; financial information; passwords; private form content.
Collect Enough Data Before Drawing Conclusions
A heatmap can technically be generated from small traffic volumes, but a handful of sessions is not a stable basis for redesign. Collect enough visits to see a repeated pattern. The right sample depends on: traffic; listing life; conversion volume; segment size. Do Not Combine Desktop and Mobile Conclusions. A pattern may disappear when separated by device. Always check major findings by device before making a universal change.
Turn Heatmap Observations Into Testable Hypotheses
Weak process: “The CTA looks cold, so make it red.” Better process: “Only 15% of mobile visitors reach the tour form, so moving a compact scheduling CTA above the description may increase tour starts.” Then Test. Use an A/B or controlled before/after test where possible. Measure: inquiry rate; tour requests; phone clicks; form completion; qualified leads. Do Not Optimize for Clicks Alone. More clicks are not always better. A confusing page can generate many clicks. The important question is whether interaction leads to: understanding; qualified inquiry; tour; sale-related action.
A Practical Heatmap Workflow for Property Listings
Define the listing conversion goal.; Confirm analytics installation and consent.; Collect a useful sample.; Separate mobile and desktop.; Review click maps.; Review scroll maps.; Identify dead/rage/error clicks.; Watch relevant recordings.; Form one clear hypothesis.; Test one change.; Measure conversion—not only interaction. Example 1: Tour Button Is Too Low. Observation: 60% of visitors never reach the form. Hypothesis: an earlier scheduling CTA will increase tour requests. Test: add a compact CTA beneath the property facts. Measure: completed tour requests per listing view. Example 2: Users Click the Hero Image Repeatedly. Possible interpretation: users expect full-screen gallery access. Test: make the entire hero image open the gallery. Example 3: Mobile Map Causes Rage Clicks. Possible issue: the map intercepts scrolling. Test:
use a static preview with “Open interactive map.”. Example 4: Similar Listings Get More Clicks Than Contact. This may mean: visitors like the market but reject the specific listing. Consider improving: lead capture for property alerts; saved searches; agent assistance CTA. Working With a Real-Estate Marketing Team. A skilled Real Estate Marketing Agency should not simply install a heatmap and send screenshots. Useful work includes: analytics configuration; segmentation; hypothesis creation; design changes; A/B testing; lead-quality analysis; reporting. Which conversion event will we optimize?; How will mobile and desktop be separated?; How much traffic is needed before decisions?; How will privacy/consent be handled?; Will changes be tested?; How will lead quality be measured?. Do heatmaps show where users look?. Not precisely. Interaction and attention maps are behavioral analytics, not a substitute for true eye-tracking equipment. What heatmap should a property site start with?. Click and scroll maps are usually the most immediately useful because they show interaction and page reach. What are rage clicks?. Repeated rapid clicks in a small area, often signaling frustration or an unresponsive interface. Should every cold section be removed?. No. Some content is important for a smaller subset of serious buyers, legal disclosure, or SEO even if it receives less interaction. How often should heatmaps be reviewed?. After meaningful traffic accumulates, after major page changes, and periodically for high-value templates.
Conclusion
Heatmaps make property listing optimization more concrete by showing how real visitors interact with the page rather than relying on internal assumptions about what buyers should do. The most useful signals are often simple: whether the gallery behaves as expected, whether users see the CTA, where mobile visitors drop off, whether forms produce error behavior, and which information gets repeated interaction. Modern tools such as Microsoft Clarity now provide several heatmap types, including click, scroll, area, conversion, and attention maps. Use those signals for what they actually measure rather than treating cursor behavior as literal gaze tracking. Most importantly, do not redesign a listing because one heatmap “looks hot” or “looks cold.” Segment the data, inspect recordings, form a specific hypothesis, make a controlled change, and measure whether qualified inquiries or tour requests actually improve.